Squish can generate a variety of statistical information on projects from the Reports menu. To see the statistics kept on a project, go to a project and select the report you would like to see. Most of these reports can also be found under the Actions menu on a search results page.
The choices are as follows:
Issue Counts
Displays a count of issues grouped by the project field specified. From the Limit To dropdown menu, select which issues will be included: all issues or one of your saved searches. By default, the current search will be selected, even if it was unsaved. Make a selection from the By dropdown list to group issues by a particular project field.
The selected grouping field values will be displayed along with a count of issues meeting those criteria in your search and a percentage of the total issues in the search with that value.
Click on a row's count to see a list of the issues in your search which have that value for the grouping field.
This report can be exported.

Issue Grid
Displays a grid of issue counts grouped by the two fields specified. From the Limit To dropdown menu, select which issues will be included: all issues or one of your saved searches. By default, the current search will be selected, even if it was unsaved. Make selections from the Row variable dropdown lists to group issues by Type, Status, Version/Milestone, Submitted by, Assigned to, or Priority. Mae a selection from the Column variable dropdown list to group issues by a particular project field. Check the box next to Hide Empty Columns to not displayed any columns that have no issues that meet that criteria. A grid will be displayed showing the count of issues meeting the row/column value criteria in each cell. Click on a count to see the issues in your search which have those values.
This report can be exported.

Most Viewed
Displays a list of the most viewed issues. This is calculated by how many times the detail for each issue has been viewed, which is listed next to each issue. By making a selection from the drop-down Limit To list, the issues displayed can include all issues or only those issues that meet the criteria in the saved search you select. Limit the number of issues appearing in the grid by selecting a number from the Show drop-down menu. You can select the Top 5, Top 10, Top 15, Top 25, or Top 50. Open any of the issues on the grid by clicking on the Issue ID link or the Subject.

Most Watched
Displays a list of the most watched issues. This is calculated by how many members have the issue on his or her Watch List, which is displayed next to each issue in the list. By making a selection from the drop-down Limit To list, the issues displayed can include all issues or only those issues that meet the criteria in the saved search you select. Limit the number of issues appearing in the grid by selecting a number from the Show drop-down menu. You can select the Top 5, Top 10, Top 15, Top 25, or Top 50. Open any of the issues on the grid by clicking on the Issue ID link.

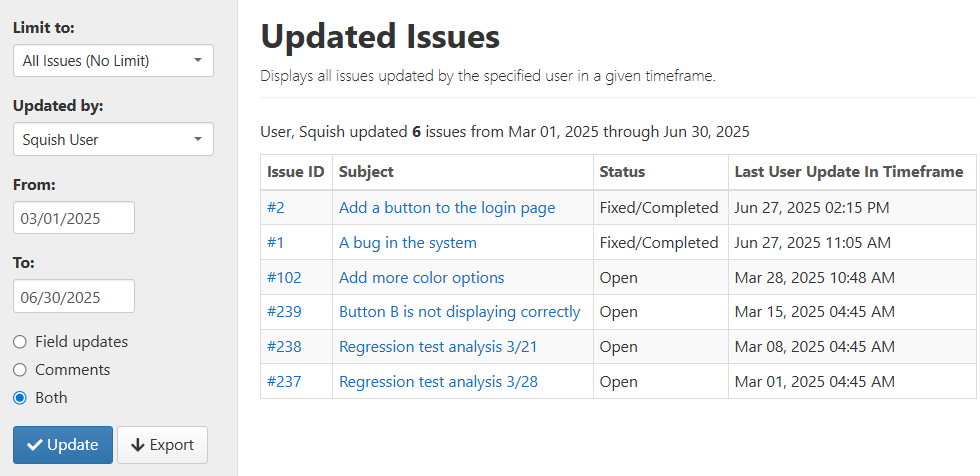
Updated Issues
Displays issues updated by a specified user in a given time frame. A description of the search and the count of returned issues is displayed at the top. By making a selection from the drop-down Limit To list, the issues displayed can include all issues or only those issues that meet the criteria in the saved search you select. Select the user from the Updated by drop-down list. Select the time frame by selecting a value in the From and To date fields. Select a radio button to include Field Updates, Comments or Both. Field Updates includes changes made in any field except Comments. Comments includes only changes made in the Comments field. Both includes all changes. The date that the selected user last updated for the issue within the specified timeframe is displayed in the list. Open any of the issues on the grid by clicking on the Issue ID link.
This report can be exported.
Resolved Issues
Displays all resolved in a given time frame, grouped by the resolving user. By making a selection from the drop-down Limit To list, the issues displayed can include all issues or only those issues that meet the criteria in the saved search you select. Select the user from the Updated by drop-down list. Select the time frame by selecting a value in the From and To date fields. Select a radio button to Group by User or Group by Date.
A list of issues will be displayed with links to each issue and the date/time it was resolved. Open any of the issues on the grid by clicking on the Issue ID link.

Trending Issues
Displays the issues that have been frequently commented or updated recently. By making a selection from the drop-down Limit To list, the issues displayed can include all issues or only those issues that meet the criteria in the saved search you select. Enter the number of issues to show and the date those issues have been trending since. Issues will be listed along with the number of comments, number of field updates and last activity.

Field History
Displays the historical changes of specified fields. By making a selection from the drop-down Limit To list, the issues displayed can include all issues or only those issues that meet the criteria in the saved search you select. Enter the Field to be searched on, User, From, and To values. A list will be displayed, showing the issue, old value, new value and updating user for all changes within your search made to the selected field in the specified timeframe.
This report can be exported.

Submission Grid
Only available via the project reports menu option. Displays a breakdown of submitted issues and resolution time by the selected frequency: daily, weekly, or monthly. Each row represents a day/week/month within in the date range selected. The total number of submitted issues is listed for each row, along with the resolved count and percent for each of the following timeframes: 0-30 days, 30-60 days, 60-90 days, > 90 days, and Unresolved. You may select the Submission Date field and Resolution Date field.

Backlog Report
Only available via the project reports menu option. Displays a breakdown of submitted issues and resolution time by the selected frequency: daily, weekly, or monthly. Each row represents a day/week/month within in the date range selected. The total number of submitted issues is listed for each row, along with the resolved count and percent for each of the following timeframes: 0-30 days, 30-60 days, 60-90 days, > 90 days, and Unresolved. You may select the Submission Date field and Resolution Date field.
Note: The Limit To drop-down list will only include saved searches that include search criteria. The Recently Updated Issues search in not included because it does not include any search criteria. It only displays all of the issues in the order they were last updated.